Focusing on the charts and volume
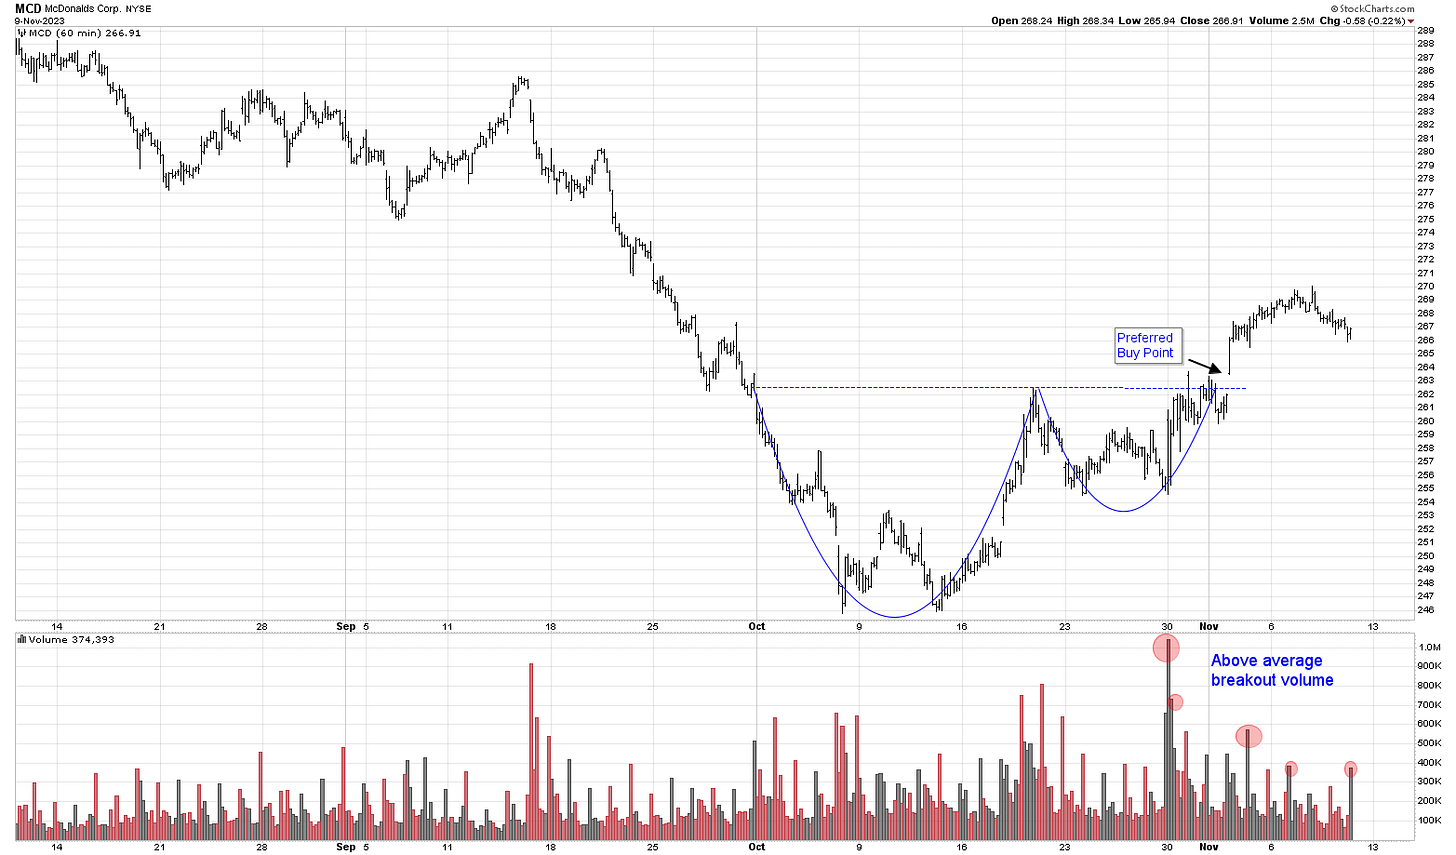
McDonald’s nailed its earnings on October 30th and now the market is in an accumulation period leading into 2023 Investor Update event on December 6. For the time being, it has broken out of the Cup with Handle:
McDonald’s tends to adhere to several key technical markers noted below.
Monthly MA-65: Monthly in Purgatory
McDonald’s is quite sensitive to the 65 Monthly Moving Average, and the follow throughs tend to materialize when the stock price can breakthrough MA-65. It was rejected this week and will need to fight through the $270 resistance wall ($269.85) before confirming the uptrend traction.
Weekly SMA 10 & 30 Volume Analysis: Tight close, volume dry up
The good news is that it has solidly closed above the weekly MA-10 with a tight DOJI close for the week, accompanied by below-average volume. It’s more than likely that it's consolidating in this area after shaking out the weak hands and profit-takers in the past two weeks. I will not be surprised if it remains here for the next weekly session or two before breaking out leading into the Investor Day in the first week of December.
Daily 13-EMA and 65-EMA Crossover: Potential trend confirmation
We’re getting near the daily EMA-13, around $264-265, for another test and consolidation, in my opinion. This is likely to bring the gap between EMA-13 and 65 closer. The EMA13/65 crossover is what I’m personally waiting for before the Golden Cross (SMA 50/200) that is likely to materialize much later.
It’s in purgatory.
All in all, it’s on the right track to potentially hit my $295 price target in the coming months. However, I believe the $270 resistance wall will be re-tested again leading into Thanksgiving. I did increase my January 2024 OTM call position on November 10, while the rest of the market rallied. It’s best to add McDonald’s options when its implied volatility is low and other high beta names are receiving the attention.
Disclaimer: I have a long position in MCD, with OTM calls expiring on January 19, 2024.


