$DKNG DraftKings is a choppy "hidden" gem
It will require withstanding volatility
I’ll start by saying that my timeframe for trading options is typically less than 60 DTEs, roughly covering eight weeks. Each position represents less than 2% of my total trading portfolio. Aside from news-driven corporate events, keep in mind that the shorter the timeframe, the less likely fundamentals matter. As Graham said, in the short term, it’s “a voting machine.”
My current DKNG position is negligible, but there might be something brewing under the hood, particularly when looking at the weekly chart. Before diving into the technicals, I’ll cover the corporate fundamentals that could impact the business in the short term. I can’t imagine putting on a trade without giving some weight to them.
Q4's NFL "Customer Friendly" Outcomes
Q3 earnings provide insightful clues, stemming from “customer-friendly” outcomes in the NFL early in the fourth quarter. These outcomes appear to have caught the company by surprise, as they described it as “the most customer-friendly stretch of NFL sport outcomes [they] have ever seen.” This unexpected turn resulted in headwinds of $250 million and $175 million to fiscal year 2024 revenue and Adjusted EBITDA guidance, respectively. Oof!
CEO Robins made a point during the call regarding the Ravens’ 35-34 win over the Bengals on Thursday Night Football as an example of how a single game can impact its top and bottom lines :
“Just last night, if the Bengals made that two-point conversion or if they didn’t score that last touchdown, there would have been very different outcomes...So, things can swing either way. Over a longer period of time, it normalizes.”
This is no different from a casino business operating as the “house” in a sportsbook. In the long run, outcomes will generally swing back in the house’s favor. As a result, these impacts are negligible over the next quarter or two and will ultimately revert to the mean with time.
For now, this is a legislative trade
For those not paying attention to state legislative news, this trade can be supremely frustrating, especially if you’ve been holding the position for some time. It’s a false Peter Lynch trade driven by recency bias. For example, when you see “all” of your peers making bets on DraftKings, encounter promotional materials during games, and scroll through social media posts about parlay wins, it can feel like everyone is betting on sportsbooks.
However, DraftKings is still navigating regulatory growing pains. Strong momentum is often disrupted by unexpected news, such as state tax hikes or new proposals that could undercut the company’s profitability. It’s incredibly frustrating, and the chart reflects this.
As of November 19, DraftKings operates in 25 states. It’s important to remember that gambling laws are contentious, and history suggests that adoption may remain uneven and slow due to political and cultural differences among states. For example, it’s easy to see why Nevada’s legislature has not passed online sports betting. Some states may prefer to focus solely on expanding casinos, viewing online sports betting as a potential impediment to those efforts, while others may have underlying "religious" objections.
DraftKings’ revenue model is straightforward. Like any casino house, it sets odds that slightly favor the house, ensuring it profits in the long run by retaining players’ losing bets.
More importantly, this trade hinges on the increasing legalization of sports betting across the U.S., making it inherently choppy and sensitive to knee-jerk reactions from Bloomberg headlines. More players mean more bets, ultimately driving higher adjusted EBITDA.
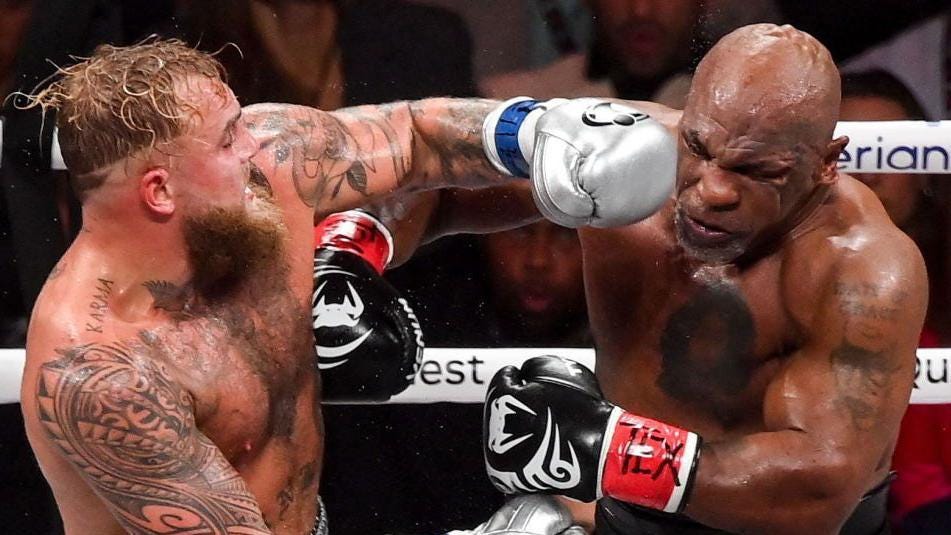
Now, consider the recent Paul vs. Tyson fight, which drew 60 million households. This event was highly favorable for sportsbooks because they collect a commission, or “vig,” from each bet. Additionally, public bettors heavily backed Tyson over Paul. As I mentioned, DraftKings profits from losing bets, and with Tyson “losing,” this further strengthened their position. I view this as a strong reason to go long ahead of the next earnings report in mid-February 2025.
Always look to the weekly chart first
Despite my concerns about regulatory hurdles over the next six months, there’s a lot to like about the current technical setup on the weekly chart, which, in my opinion, could attract momentum traders and help overcome these barriers for a decent trade:
1. Long-term setup: The chart has formed a Cup with Handle pattern on the weekly timeframe, inching toward the handle high of $50.
2. Intermediate-term breakout: There’s a clear breakout from an inverse Head & Shoulders (IHS) pattern.
3. Institutional crossover: The 10-week and 30-week moving average (WMA) crossover—an institutional favorite—has triggered.
As of today, Goldman reiterated a Buy rating with a raise price target from $54 to $57. The CIQ average price target is $50.73 with a high forecast of $77.00 and a low forecast of $33.00.
Here’s a little secret when using Capital IQ (CIQ) Price Targets: if you chart the CIQ high and low range over the past few years, you can identify the general price range it traverses. Some traders capitalize on moves from the mean to the high, or vice versa. In this case, it tends to sell off near the CIQ Mean, so you’ll know when I plan to trim.
As for options, I currently hold multiple contracts between $45 and $50. My focus is on buying time and near at-the-money (ATM) strikes to cover the next earnings in February, accounting for the implied volatility (IV) buildup and the Tyson-Paul bets. For example, the 3/21/25 $45C contracts show decent open interest (OI) and volume with a reasonable spread. If this is purely a technical play, expiration dates matter less—but I’d avoid February contracts since they can quickly lose premium post-earnings.
All in all, this is one of my favorite setups at the moment.
Disclaimer: This is not financial advice, and it would be ridiculous to interpret it as such.


